
Finetuning Azure Application Insights in CMS12
The problem
If you have ever managed a DXP environment, you might have found the Azure Application Insights log to look like this:
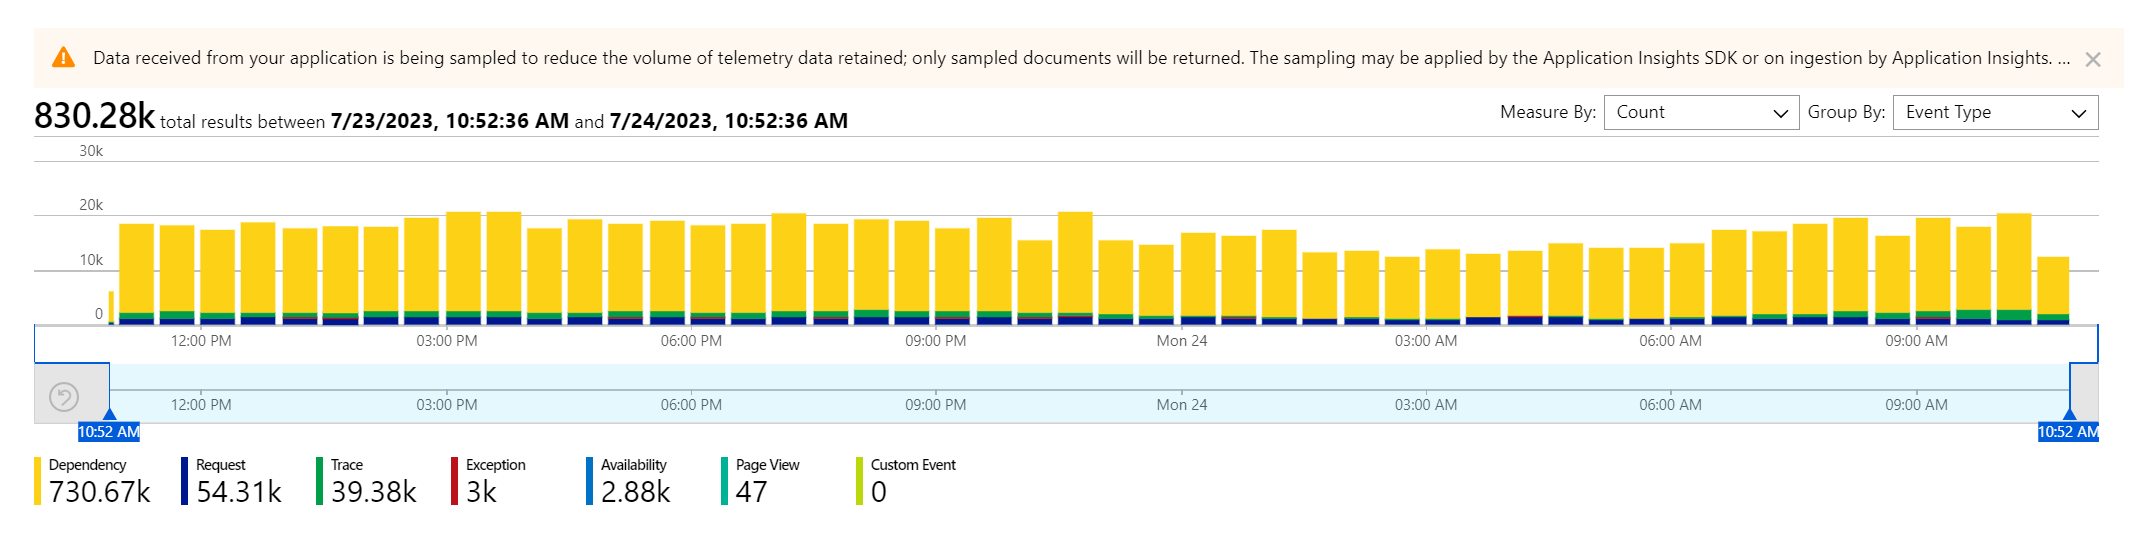
The Dependency logging is dominant, representing most of the data. Also note the warning that sampling is active: not every message comes through.
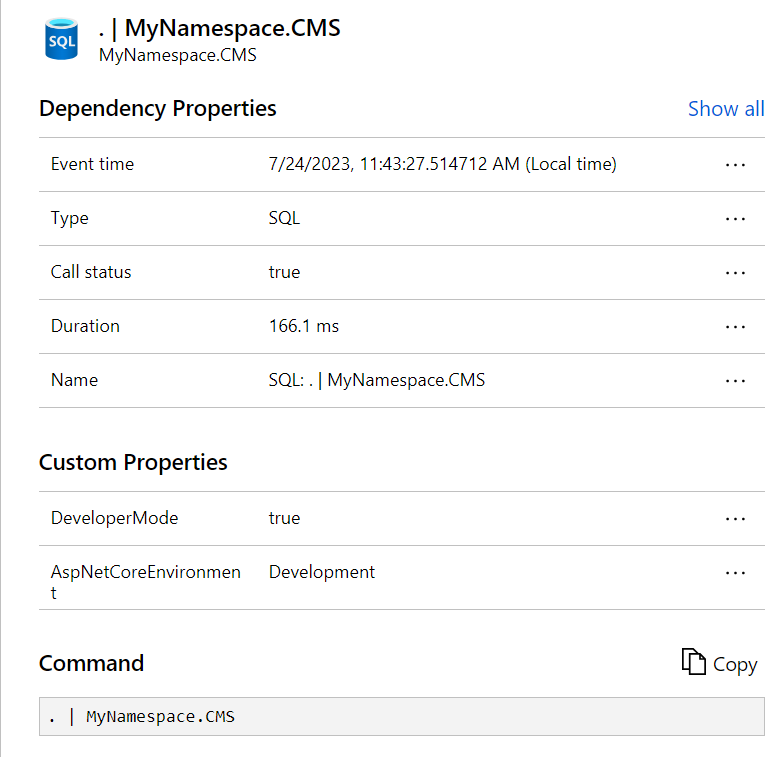
On closer inspection, the Dependency logging mostly consists of uninformative SQL messages:
The main goal to achieve was:
Create high fidelity application logging for our custom codebase
This was hindered by the telemetry sampling as not every message was guaranteed to come through.
To reach this goal, the following subtasks are implemented:
- Configure custom application logging to allow Informational messages
- Reduce Dependency logging to the level where sampling can be turned off
- Retain SQL logging for longer-duration queries
Application Insights provider setting
Configure the provider for ApplicationInsights in appsettings.json. See documentation.
  "Logging": {
    "LogLevel": {
      "Default": "Warning",
      "Microsoft": "Warning",
      "EPiServer": "Warning",
      "Microsoft.Hosting.Lifetime": "Warning"
    },
    "ApplicationInsights": {
      "LogLevel": {
        "Default": "Warning",
        "MyNamespace": "Information",
        "Microsoft": "Warning",
        "EPiServer": "Warning"
      }
    }
  },
This will cause everything to emit Warnings only, except for our projects' messages which are Information and up.
Custom Application Insights options
To make these changes, the following IServiceCollection extension method is introduced:
public static class ServiceConfigurationContextExtensions
{
    public static void AddCustomApplicationInsights(this IServiceCollection services)
	{
        ApplicationInsightsServiceOptions aiOptions = new ApplicationInsightsServiceOptions();

        // Disables adaptive sampling.
        aiOptions.EnableAdaptiveSampling = false;

        // Disables QuickPulse (Live Metrics stream).
        aiOptions.EnableQuickPulseMetricStream = true;
        aiOptions.EnableDependencyTrackingTelemetryModule = true;

        services.AddApplicationInsightsTelemetry(aiOptions);
        services.AddApplicationInsightsTelemetryProcessor<SqlDependencyFilter>();

        services.ConfigureTelemetryModule<DependencyTrackingTelemetryModule>((module, o) =>
        {
            module.EnableSqlCommandTextInstrumentation = true; // Injects SQL cmd text into telemetry
        });
    }
}
Notably, this will:
- turn off adaptive sampling
- add a custom telemetry processor
- turn on SQL command text logging
It is loaded in startup.cs, and must be before AddCmsCloudPlatformSupport.
public void ConfigureServices(IServiceCollection services)
{
    if (!_webHostingEnvironment.IsDevelopment())
    {
        services.AddCustomApplicationInsights();
        services.AddCmsCloudPlatformSupport(_configuration);
        services.AddCommerceCloudPlatformSupport(_configuration);
    }

    ....
}
The custom telemetry processor SqlDependencyFilter introduces a filter to all messages "SQL" to only process if the duration is greater than 100ms:
public class SqlDependencyFilter : ITelemetryProcessor
{
    private ITelemetryProcessor Next { get; set; }

    // next will point to the next TelemetryProcessor in the chain.
    public SqlDependencyFilter(ITelemetryProcessor next)
    {
        this.Next = next;
    }

    public void Process(ITelemetry item)
    {
        // To filter out an item, return without calling the next processor.
        if (!OKtoSend(item)) { return; }

        this.Next.Process(item);
    }

    private bool OKtoSend(ITelemetry item)
    {
        var dependency = item as DependencyTelemetry;

        if (dependency == null || dependency.Type != "SQL") return true; // only filter for Dependency & SQL

        if (dependency.Duration.TotalMilliseconds < 100) return false; // we don't want shorties

        return true; // this is a long SQL query
    }
}
Results
Typically, Application Insights for a site with these changes applied looks like this:
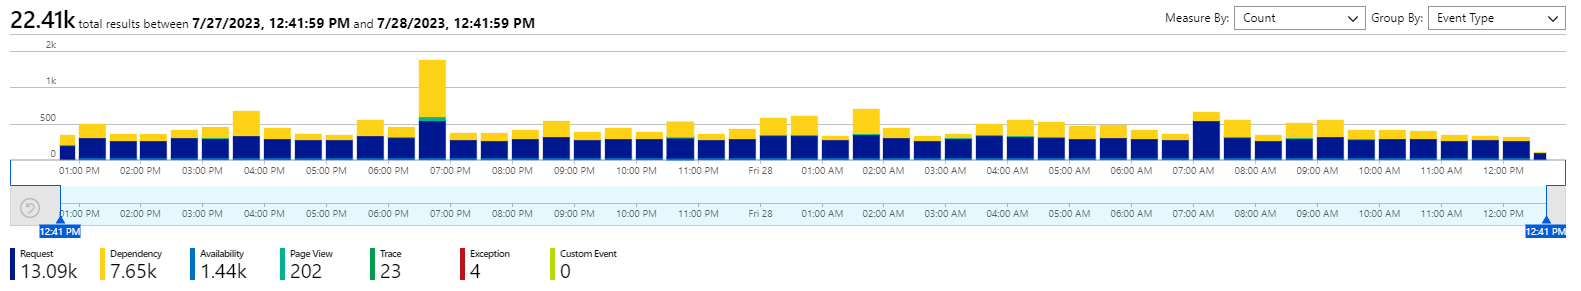
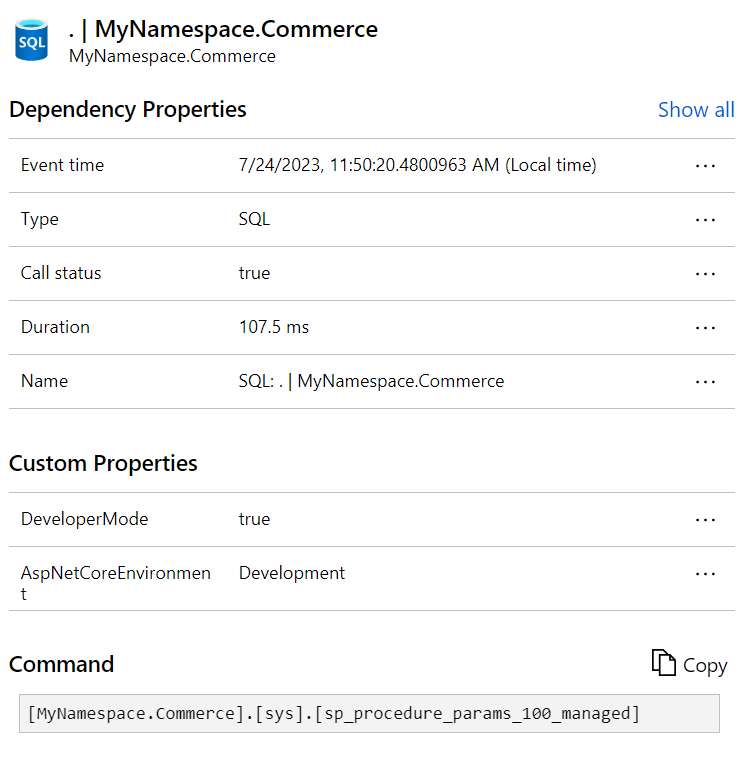
With a notably smaller Dependency component. Its SQL logging will be for queries with a minimum of 100ms duration, and the actual SQL command will be included.
Also note the sampling warning message has disappeared.
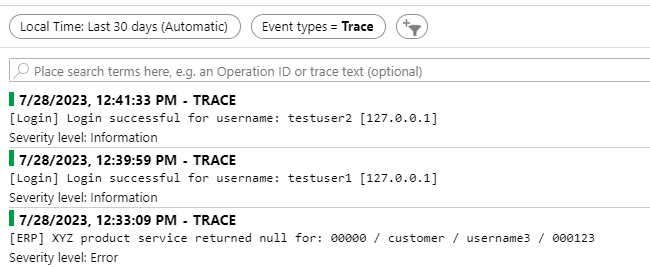
Our application's Information messages are unfiltered, appearing as Trace messages:
Any thoughts or concerns, please let me know!
Comments